|
OPTICAL ACUMEN At the Intersection of Data Visualization and Investment Research |
|||
|
Tuesday, June 24, 2014 The Beautiful GameI'm not a big soccer fan, so I can't say whether these mappings of player movements by Susken Rosenthal are a useful way to analyze a match. But the results are truly beautiful. (Thanks to my Morningstar colleague Pouya Ahmadi for the tip!) 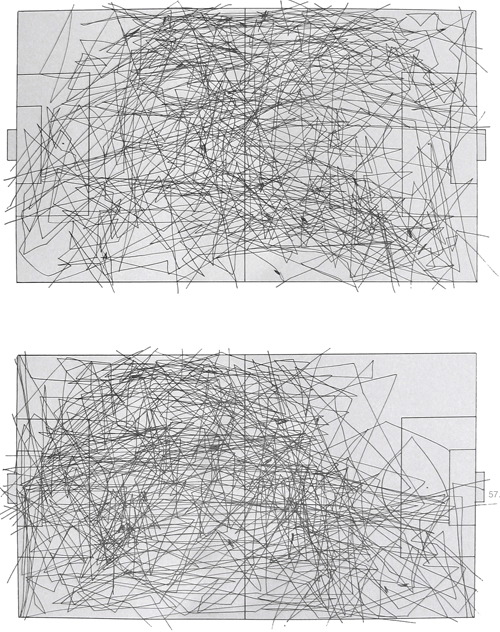
Mike Deal's soccer charting system is also worth a look -- I find it preferable to the graphics the WSJ has been running during the World Cup. Follow @davidharrell Tweet 
|
Throughout my career at Morningstar, the Chicago-based investment research firm, I've used creative language and visual elements to explain complex investment information and ideas. This is a personal site--all opinions expressed here are my own.
Contact David Harrell personal website Links Graphic Detail EagerEyes FILWD Morningstar Magazine's Chart Tumblr Spurious Correlations Statpics Storytelling with Data Visual Complexity Recent Posts Archives June 2014 July 2014 August 2014 November 2014 February 2015 April 2015 January 2016 February 2016 March 2016 January 2017 March 2017 July 2017 |