|
OPTICAL ACUMEN At the Intersection of Data Visualization and Investment Research |
|||
|
Monday, June 30, 2014 Style BoxingI have a short piece in the June/July issue of Morningstar Magazine. It's a re-imagining of the iconic Morningstar Style Box, based on the idea of varying the size of each segment of the box according to market capitalization or number of stocks: 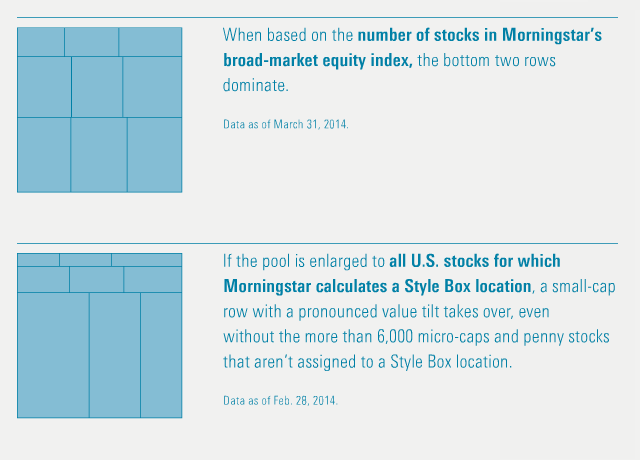
You can read the Nxtbook version of the full article (and the rest of an excellent magazine) here. Or use this link to download a PDF version of the magazine. Follow @davidharrell Tweet 
Thursday, June 26, 2014 Edward Tufte...100 Years AgoIn 1914's "Graphic Methods for Presenting Facts," Willard Cope Brinton sounds a LOT like Tufte ("This type of chart should be banished to the scrap heap.") as he dissects different chart types and criticizes poor visualization practices such as increasing area when only one dimension should change: 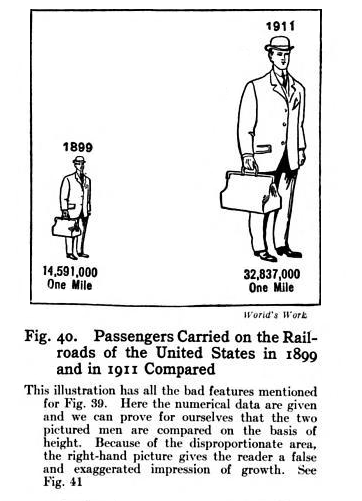
Follow @davidharrell Tweet
Tuesday, June 24, 2014 The Beautiful GameI'm not a big soccer fan, so I can't say whether these mappings of player movements by Susken Rosenthal are a useful way to analyze a match. But the results are truly beautiful. (Thanks to my Morningstar colleague Pouya Ahmadi for the tip!) 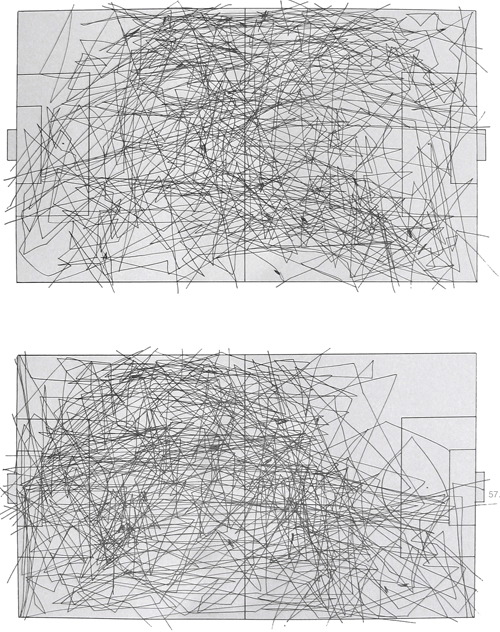
Mike Deal's soccer charting system is also worth a look -- I find it preferable to the graphics the WSJ has been running during the World Cup. Follow @davidharrell Tweet
|
Throughout my career at Morningstar, the Chicago-based investment research firm, I've used creative language and visual elements to explain complex investment information and ideas. This is a personal site--all opinions expressed here are my own.
Contact David Harrell personal website Links Graphic Detail EagerEyes FILWD Morningstar Magazine's Chart Tumblr Spurious Correlations Statpics Storytelling with Data Visual Complexity Recent Posts A Ten-Year Performance Current Visualizing an Investment Watchlist Clocking 2016 Investment Performance Another Year on the Clock Stacking Two Market Corrections Histogram Jam Investment Performance Currents Mapping Investment Portfolios and Indexes Clocking Investment Performance Charting an Investment Portfolio by Holding Time Archives June 2014 July 2014 August 2014 November 2014 February 2015 April 2015 January 2016 February 2016 March 2016 January 2017 March 2017 July 2017 |