|
OPTICAL ACUMEN At the Intersection of Data Visualization and Investment Research |
|||
|
Wednesday, July 16, 2014 Data Visualization in 1919Readers of Edward Tufte will remember this graphic from his first book: 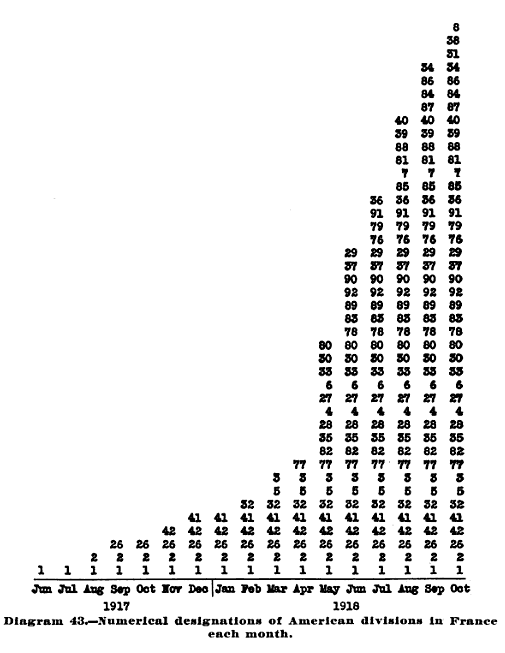
The book is filled with charts and visualizations, and while the quality of execution varies, it's amazing to see the 95-year-old work of Ayres. As Tufte observed, the book contains "several notable graphics all done by typewriter and rule." Follow @davidharrell Tweet 
|
Throughout my career at Morningstar, the Chicago-based investment research firm, I've used creative language and visual elements to explain complex investment information and ideas. This is a personal site--all opinions expressed here are my own.
Contact David Harrell personal website Links Graphic Detail EagerEyes FILWD Morningstar Magazine's Chart Tumblr Spurious Correlations Statpics Storytelling with Data Visual Complexity Recent Posts Style Boxing Edward Tufte...100 Years Ago The Beautiful Game Archives June 2014 July 2014 August 2014 November 2014 February 2015 April 2015 January 2016 February 2016 March 2016 January 2017 March 2017 July 2017 |